Android性能检测Trace总结
背景
最近项目用到了TraceView做性能分析,在此总结一下。
使用方法
- DDMS方式生成
.trace和.html均可使用DDMS生成,AndroidStudio3不再有TraceView,可通过android sdk/toos/monitor打开。按钮具体位置不在陈述。
- 代码生成
//.trace文件
Debug.startMethodTracing("tracefilename");
Debug.stopMethodTracing();
//trace.html
Trace.beginSection("sectionName");
Trace.endSection();
推荐用DDMS动态生成,因为可随时开始随时停止,生成的文件包含的时间长。代码生成是固定的位置,且.trace文件默认五秒。
.html使用Chrome打开即可,trace使用TraceView打开。
分析
- trace.html
打开文件后,可通过键盘adws键控制左右放缩,右侧的Alert栏目为检测出的所有问题。
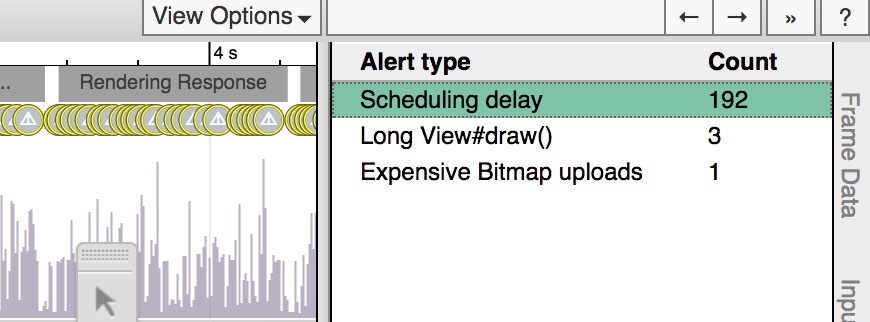
可以看到有三类问题,点击之后会在下方出现详细内容
Alert
Scheduling delay
Running
8.495 ms
Sleeping
20.145 ms
Not scheduled, but runnable
0.542 ms
Frame
Description
Work to produce this frame was descheduled for several milliseconds, contributing to jank. Ensure that code on the UI thread doesn't block on work being done on other threads, and that background threads (doing e.g. network or bitmap loading) are running at android.os.Process#THREAD_PRIORITY_BACKGROUND or lower so they are less likely to interrupt the UI thread. These background threads should show up with a priority number of 130 or higher in the scheduling section under the Kernel process.
Scheduling delay说明这个处理特定时间片的线程很长时间没有被CPU调度,因此这个线程花了很久才完成。可能是因为开启了太多的线程和UI线程竞争CPU资源,导致UI线程迟迟不能执行。
Alert
Long View#draw()
Time spent
3.148 ms
Record View#draw()	took 48.63ms
Frame
Description
Recording the drawing commands of invalidated Views took a long time. Avoid significant work in View or Drawable custom drawing, especially allocations or drawing to Bitmaps.
Video Link	Android Performance Patterns: Invalidations, Layouts, and Performance
Video Link	Android Performance Patterns: Avoiding Allocations in onDraw()
顾名思义,draw方法中做了太多的事情
Alert	Expensive Bitmap uploads
Pixels uploaded
"0.00 million"
Time spent
5.306 ms
Upload 15x22 Texture	took 0.30ms
Upload 15x22 Texture	took 5.01ms
Frame
Description
Bitmaps that have been modified / newly drawn must be uploaded to the GPU. Since this is expensive if the total number of pixels uploaded is large, reduce the amount of Bitmap churn in this animation/context, per frame.
Extensive bitmap upload : -)
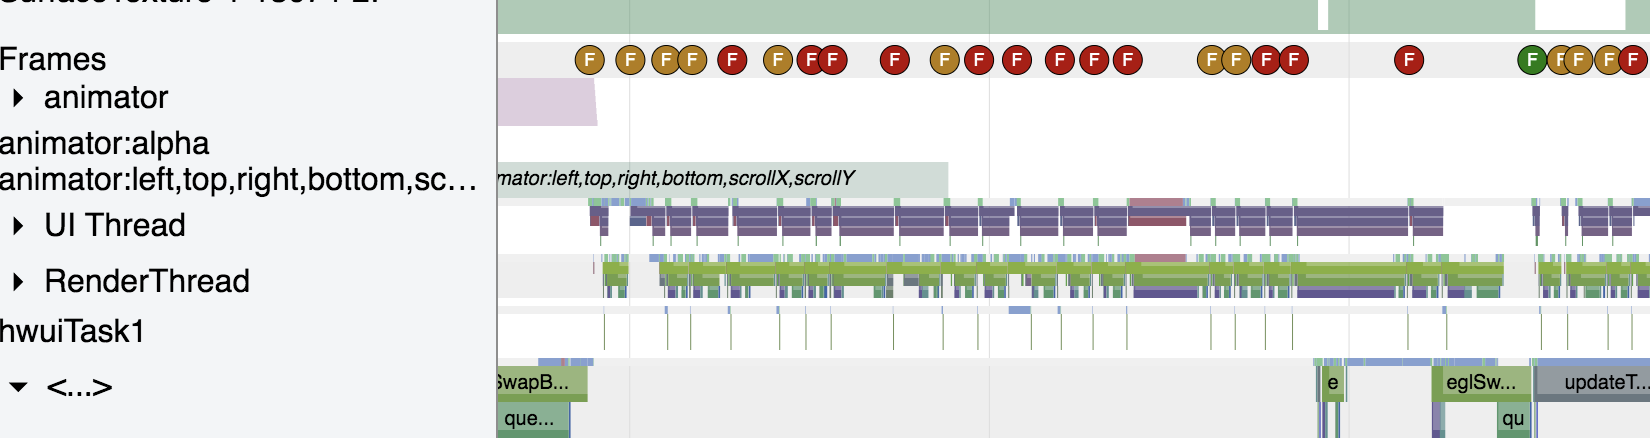
这里的F圆圈表示一帧,颜色代表性能问题,点击后会出现详细内容,和Alert中显示一样。
通过systrace就可以大体分析UI性能的问题,但是并不知道到底是哪个线程的哪个方法出的问题,这就要用到TraceView了。
- trace文件
若是用代码生成可通过 adb pull TRACE_PATH TARGET_PATH导入到PC端。
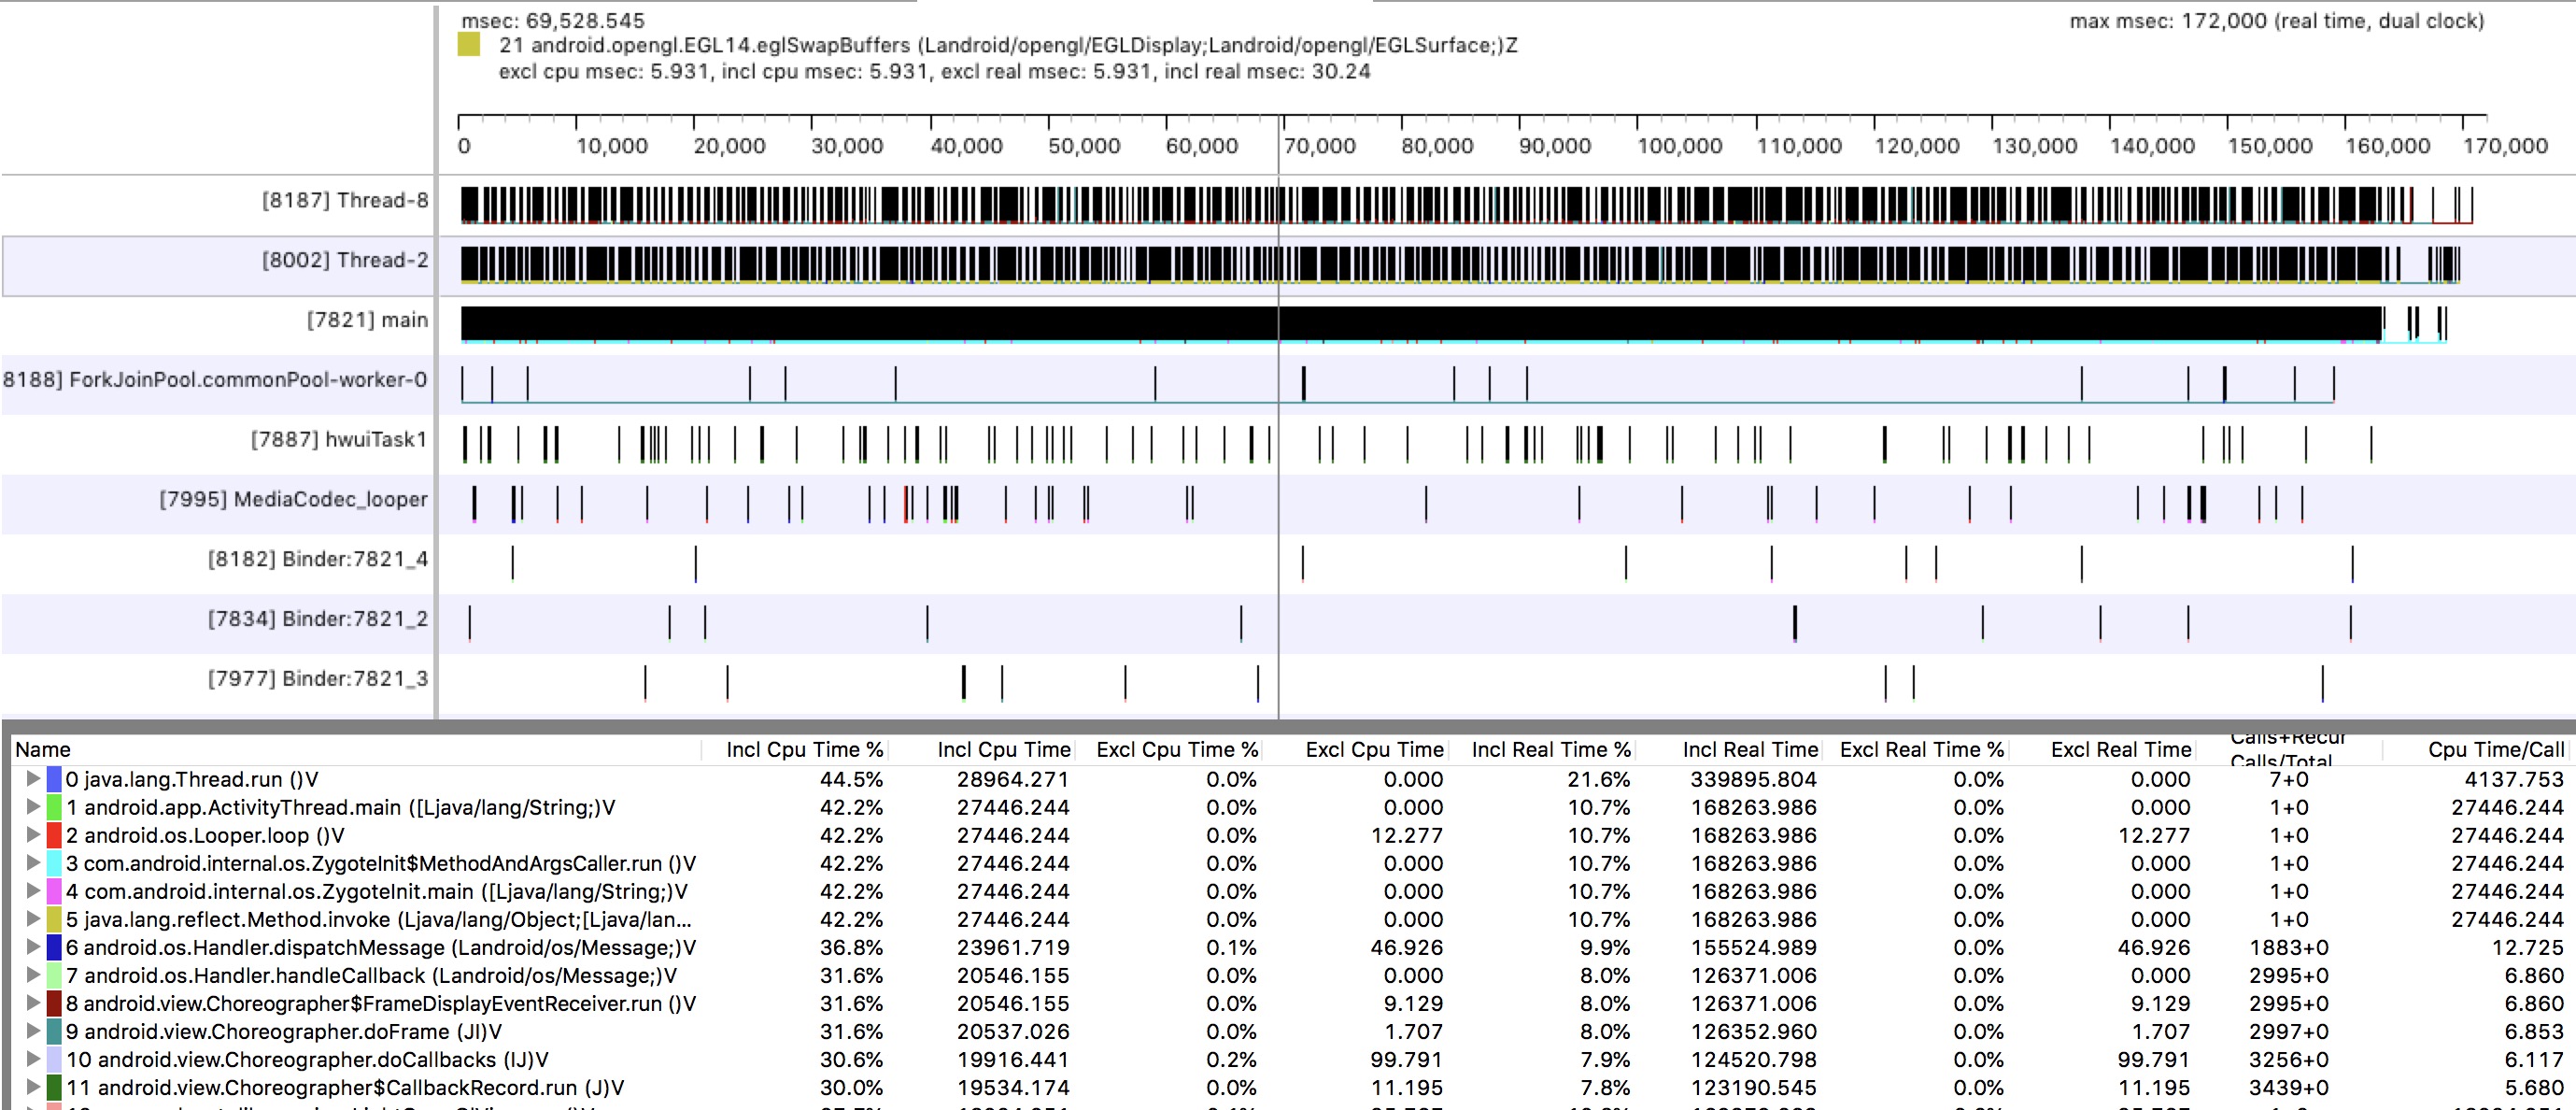
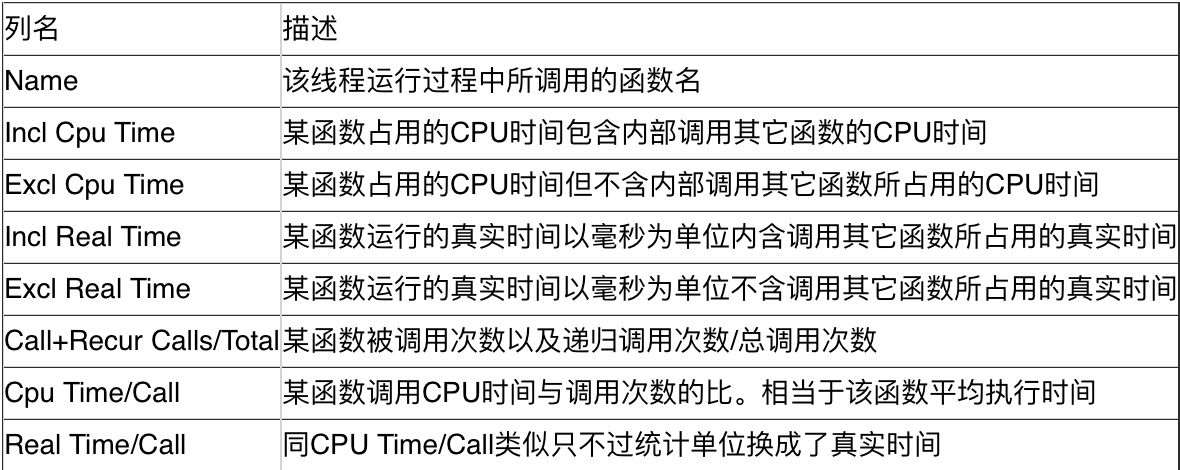
打开后可以看到如图面板,每个方法用不同颜色标注,记录了各个线程各个方法的执行时间。
也可以通过不卡顿时的trace文件和卡顿时的trace文件做对比得出结论。
详细可参考: https://yq.aliyun.com/articles/20467